Do you know that Facebook, which has more than 2.5 billion users around the world and is one of the five best social networking sites for growing your business, creates more than 4 petabytes of data every day? It’s a huge amount of information that needs one to handle in a unique way. We define it as Big Data. It slowly becomes popular, and businesses now see it as a good way to make money. In fact, many of them already use it in a lot of different ways.
Before “Big Data,” there was just “Data.” As we’ve already said, we need to process it so it doesn’t go to waste. Theoretically, Big Data Analytics is the systematic use of computers to analyze a large amount of data. You’ve come to the right place if you want to learn more about Big Data Analytics. This article is a very thorough guide to Big Data Analytics.
Recommended reading: How to Increase the Quality of Your Data
What Is Big Data Analytics?
Before we talk about what Big Data Analytics is, let’s learn more about what Big Data is.

Big Data is a popular term these days. Most people have heard this term at least once, but not everyone knows a lot about what “Big Data” means. So, what’s different about Big Data from the data you already know?
1. The three Vs of Big Data
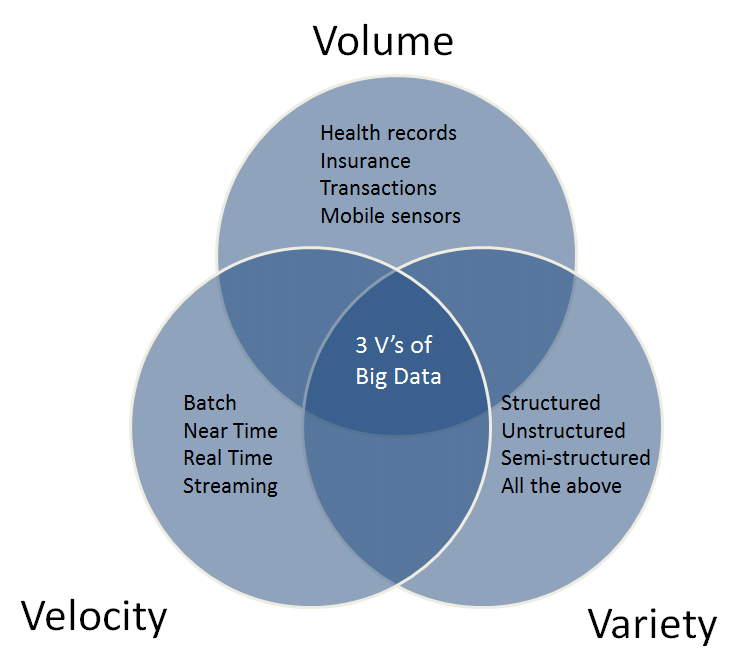
According to Mezmo, Big Data has been described in different ways up to this point. Still, in general, “Big Data” refers to large, complicated sets of data that almost all traditional software for processing data can’t handle. Big Data keeps getting bigger over time. It is often described by the so-called Vs, which are usually 3Vs: volume, velocity, and variety.
1. Volume
No one knows how much Big Data is yet, and people keep talking about how big it must be to be called “Big Data”. Big Data is always getting bigger and can be any size, from terabytes (TB) to exabytes (EB) and even zettabytes. In short, its huge size surprises us in a way that we may not be able to imagine.
2. Variety
Big Data is a collection of data that comes from many different places and has different formats and categories. Over time, Big Data stores more and more different types of data, such as structured (the traditional type), unstructured (texts, videos, audio, images, etc.), and even semi-structured files like JSON or XML.
3. Velocity
Big Data needs to be processed quickly because of its size, variety, and complexity. Usually, this means it needs to be done in real-time.
Big Data is also defined by other Vs, like Variability, Veracity, or Value, in addition to the 3Vs mentioned above. No matter how we define it, what’s important is how useful and profitable it is. Big Data, which could be a gold mine, is still useless because we only use it for one thing.
Due to its size, Big Data is hard to analyze, collect, look at, and send. But we can’t deny that it gives us a lot of good things, as it has a big effect on modern life, especially the fourth industrial revolution, which is opening up digital life.
In the digitalization age we live in now, we can’t ignore how much Big Data can help us make money. To use Big Data means to meet the need to store, analyze, collect, and remember data. Analytics for Big Data has become one of the most important things we need to do if we want to use Big Data. What is Big Data Analytics, then?
Recommended reading: Tree Data Structure: A Closer Look
2. The nine stages of Big Data Analytics
Big Data Analytics is the process of looking at data to come up with useful conclusions for businesses or other Big Data users. In fact, Big Data Analytics is the process of looking at a lot of different and large amounts of data to find patterns, correlations, and other hidden insights. Businesses are using Big Data Analytics to help them grow and make good decisions.
In particular, Big Data Analytics comprises 9 stages:
1. Business Case Evaluation:
This is the first step to figure out why or what you want to do with the data. The team that is looking at the data will find out what resources are available and how they can use them. They will also know what problems they may face. So, they can now figure out how much it will cost to do the analysis and avoid wasting money, time, and effort.
2. Identification:
Related data sets and their sources will be found. This will make it more likely that hidden patterns and connections between data will be found.
3. Accumulation and Filtering:
After the sources have been found in the previous stage, data is gathered from them. Then, useless and meaningless data will be thrown away.
4. Extraction:
The format of some of the collected data may not work with the process of analyzing, so different types of data will be extracted and changed into versions that do work.
5. Validation:
The data collected by Big Data may not be organized, may be hard to understand, or may be repeated. Because of this, it needs to be checked.
6. Aggregation:
Data comes from different data sets and is joined together through fields that are the same, even if the formats are different.
7. Analysis:
The analysis will be done over and over again until hidden patterns and links are found.
8. Visualization:
This step helps business users understand and comment on the results of the analysis. There are many ways to show the results, which has a big impact on how we understand the data.
9. Utilization of analysis results:
Businesses use the results of the analysis to make decisions or improve how they do business.
As you can see from the 9 steps above, Big Data Analytics is not an easy job. It requires highly skilled and professional Data Analysts and Scientists, whose job it is to deal with Big Data Analytics.
FURTHER READING: |
1. What Is Data Structure and Their Applications? |
2. What Is Data Classification: Best Practices And Data Types |
The 4 Types of Big Data Analytics
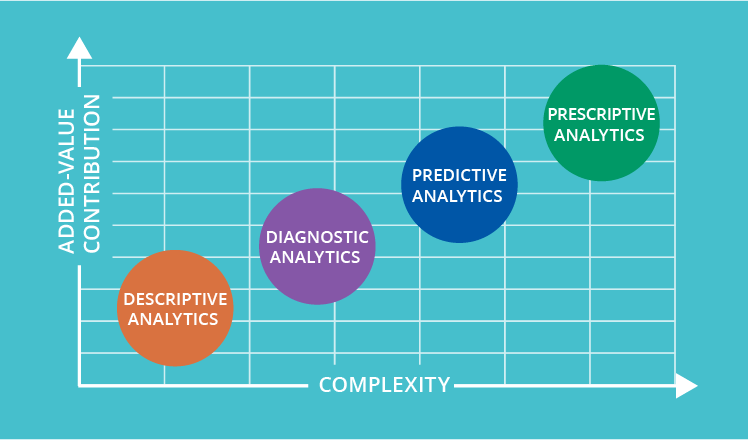
In general, Big Data Analytics falls into 4 types:
1. Descriptive Analytics
Looking at what happened in the past and making data easy for people to understand.
- Processing, analyzing, and summarizing historical and raw data to make comparisons and draw conclusions that are useful and easy to understand.
- When data mining and data aggregation are used to answer the question “What has happened?”, they look at historical data.
- Graphic patterns like bar charts, pie charts, line graphs, etc., show analytics to build a solid foundation for further analysis.
2. Diagnostic Analytics
Getting to the bottom of what made something happen in the past.
- By digging deeper and finding historical data, and then using this data to find connections between events, we can answer the question, “Why did something happen in the past?
- Finding out what data really means and why things worked or didn’t work in the past is important for improving the future and making better decisions.
3. Predictive Analytics
Making predictions about the future.
- Using algorithms to make reasonable guesses about the missing data based on the data that is already available and the correlations between different data sets. It is for figuring out the chances of possible risks, opportunities, or trends and answering the question, “What might happen in the future?”
- It is easier to predict what will happen in the future based on structured data than on unstructured data.
- Using information from the past to make predictions about what will happen in the future. This helps businesses and organizations decide what to do and how to do it.
4. Prescriptive Analytics
Putting forward recommendations and pieces of advice.
- Using descriptive and predictive analytics to come up with options and help answer the question “What should we do?”
- By showing why something is likely to happen, you can suggest what decision to take to take advantage of opportunities and avoid risks.
In a nutshell, the four types of Big Data Analytics we’ve talked about so far focus mostly on using and analyzing historical data to predict the future and tell businesses what they need to do to be more efficient and effective.
Recommended reading: Stacks and Queues in Data Structures: An Overview in 2022
Why Big Data Analytics?
Big Data is just a lot of useless information that needs analysis to make sense. People are asking a lot of questions about how useful Big Data Analytics is for businesses because its use is on the rise. In other words, Big Data Analytics is a way to use Big Data so that it doesn’t go to waste.

Businesses are using Big Data Analytics more and more to get benefits from it or make money off of it. I’m going to give you three reasons why it is especially important for businesses:
1. Raising customers’ level of satisfaction
Customers are always the most important thing for businesses. To meet customers’ needs, it’s best to find out what they really want. Big Data Analytics gives a direct way to learn about customers without having to talk to every single one of them.
Businesses can use Big Data Analytics to look into or collect customer feedback about a product or service they offer. So, they can minimize their weaknesses and improve the quality of their products or services.
2. Enhancing work efficiency
Know what “information power” means? In fact, power will go to those who have information and data that others don’t have. Nowadays, what matters is how quickly you can get information. In this situation, we have to talk about Real-time Big Data Analytics. It means that businesses can get the most up-to-date information by processing Big Data as it comes in.
Stock charts are a good example. For the most up-to-date information, they need updating every minute or even every second. Traders or people who own stocks want to know the most up-to-date information about their stocks so they can make decisions or changes about selling or buying their stocks. If data on stock charts takes too long to show, financial businesses could lose customers. Because of this, the need for Real-time Big Data Analytics is growing.
3. Reducing costs
Businesses can keep their costs down by using Big Data Analytics. They don’t have to try to ask every customer in person what they think. Instead, they can just look at Big Data and gain valuable insights that way.
As an example, hospitals and patients can both save money by getting treatment online. The patient will tell the doctor about their symptoms, and the doctor will use Big Data Analytics to make a quick and accurate diagnosis. So, hospitals don’t have to spend money on building facilities, and patients don’t have to go to hospitals.
Big Data Use Cases
It’s not difficult to see cases of using Big Data nowadays. Let’s take Shopee and Google as examples.
1. Shopee
Shopee can easily figure out what its customers do by looking at their search results and online shopping bills. This is possible because it has Big Data. So, they know which products are more popular, less expensive, and better overall.
During the process of choosing products, they can also make suggestions to the customer. Shopee will suggest things like erasers, rulers, and sharpeners when a customer buys a pencil, for example. It shows that customers can have the best buying experiences when using Big Data Analytics.
2. Google
Another example is Google, which has a clear lead. It owns Big Data, of course. Because Google has so much information, many people think of it as an online encyclopedia. Google will give users a lot of useful search results in different formats and categories, like texts, images, videos, audios, or news, based on the keywords they type in.
Big Data is also in other fields, like education, health care, banking, and so on.
Trends in Using Big Data Analytics
Big Data Analytics has become more popular because it gives users a lot of good things. It becomes an important part of running a business.
Accenture says that 79 percent of business leaders are worrying that companies that don’t use Big Data Analytics will fail.
Also, because Big Data Analytics is becoming more popular, it gives job seekers a lot of chances to find work. Data analysts and data scientists have jobs that are popular all over the world and pay an average base salary of about $100,000 per year. The candidates must learn about things like the Hadoop ecosystem or NoSQL databases that have to do with Big Data Analytics.
Also, by using Big Data Analytics, machine learning and AI keep getting better and better. They get smarter and smarter over time, which makes it possible for automation and technology to get better in the future.
In the end, Big Data Analytics affects every part of life and is seen as a gold mine for people who want to make a lot of money. It’s especially important and helpful for businesses. Companies should worry about how they use Big Data Analytics in the modern, competitive world. Also, they need to learn about Big Data Analytics so they don’t fall behind in technology.
Also published on

Share post on


Table of Contents: